Application Storyboard
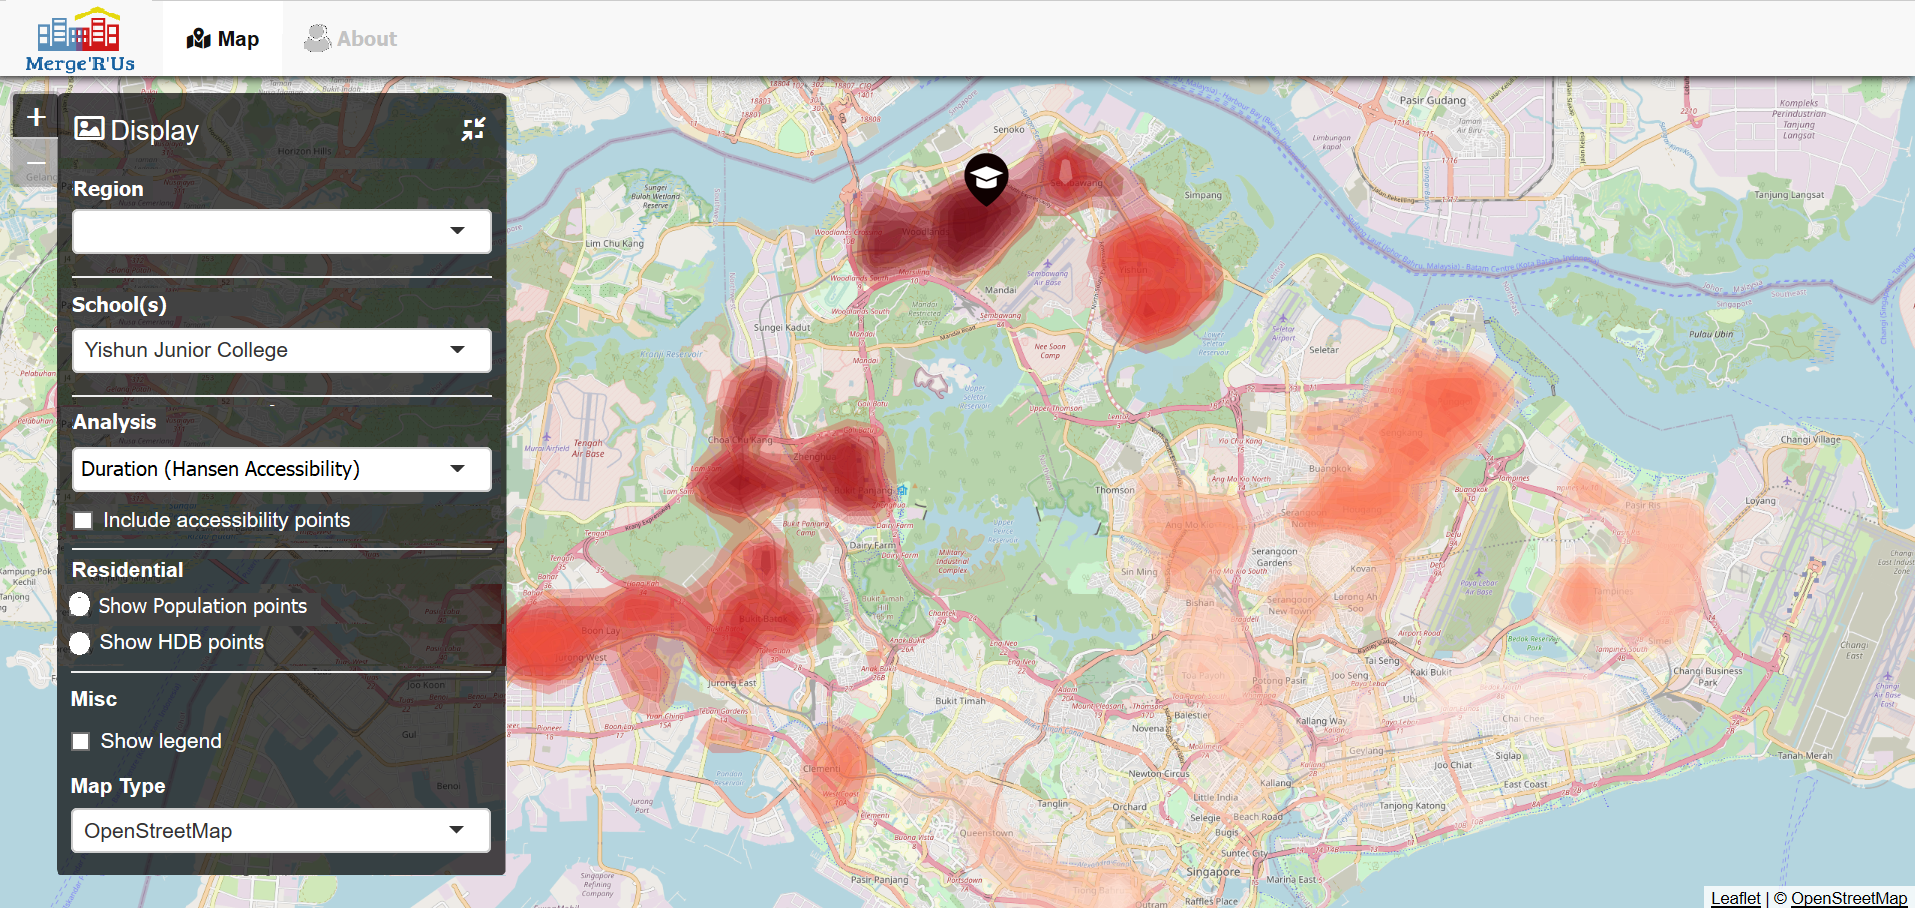
In our dashboard, we will have a Map and About tab. The following screenshots show a prototype of the Map tab.
Acknowledgement: Adapted from BURP
In the map tab, they can apply various filters to see the results they want. Namely, they can choose the following:
- Region to see the schools in that area at one glance
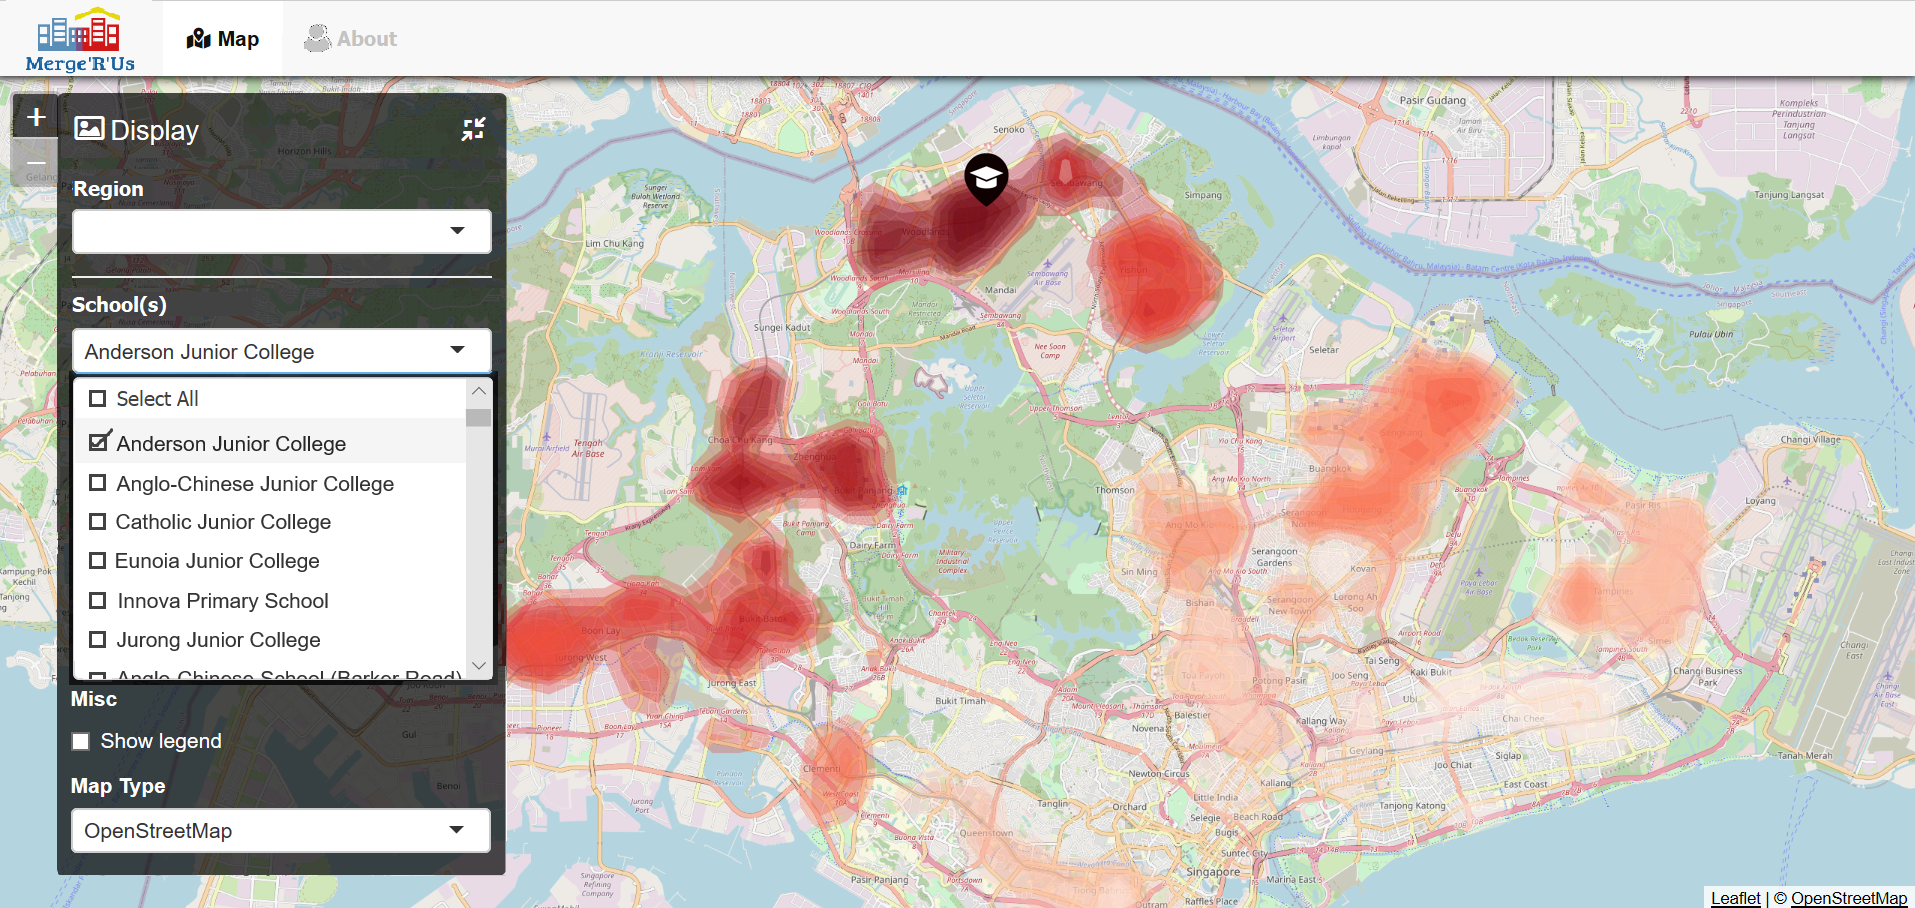
- School(s) with multi-select enabled in the dropdown function
- Type of analysis, which can be one of the following options:
- Hot & Cold Spot Areas (Getis-Ord Gi*)
- Distance (Hansen Accessibility)
- Kernel Density (KD2SFCA)
- Type of points the user wants to do the analysis on. It could be either population or housing data points
- Preferences to show accessibility points and/or legend, and the map type
Users can also find out more information about the application and how to use it in the About tab.